Filter by
Found 1 from your keywords: subject="Mathematics--Graphic ...

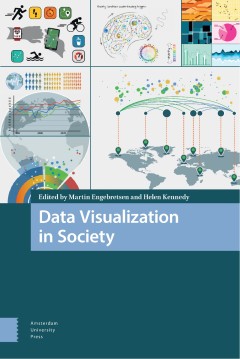
Data visualization in society
Today we are witnessing an increased use of data visualization in society. Across domains such as work, education and the news, various forms of graphs, charts and maps are used to explain, convince and tell stories. In an era in which more and more data are produced and circulated digitally, and digital tools make visualization production increasingly accessible, it is important to study the c…
- Edition
- -
- ISBN/ISSN
- 9789463722902
- Collation
- -
- Series Title
- -
- Call Number
- 001.4226 DAT d
 Computer Science, Information & General Works
  Philosophy & Psychology
  Religion
  Social Sciences
  Language
  Pure Science
  Applied Sciences
  Art & Recreation
  Literature
  History & Geography